Task: Usability analysis of an online ordering system for a wholesale marketplace of a large construction company.
My areas of responsibility: Usability Expertise, Web Analytics, User Interviews, User journey, and Usability report.
Tools: Yandex.Metrika (Russian Google Analytics analogue), MindMeister, and Google Docs.
Result: A usability expertise report.
TBM-online is the biggest online wholesale web application for furniture and window accessories in Russia. Customers used this application to place and monitor their orders. The problem was that its interface had extremely poor usability – it was very complicated and difficult to use. Moreover, the company had to hire a lot of customer support managers to coach the clients.
1. Interviews with customer support managers
I conducted several interviews with customer support managers to find out how they coach the clients and which problems they are commonly required to solve. For example, I discovered that the managers usually registered new clients manually because the registration form in the application was too complicated.
2. Expert review (heuristic evaluation)
The next step in my investigation was the expert review, which allowed me to identify the general UI problems: puzzling navigation and cluttered interface. Some pages contained a lot of irrelevant fields, buttons, and menus. Moreover, the names of some links and buttons were unclear, and the forms, which were very long and complicated, didn’t have hints.
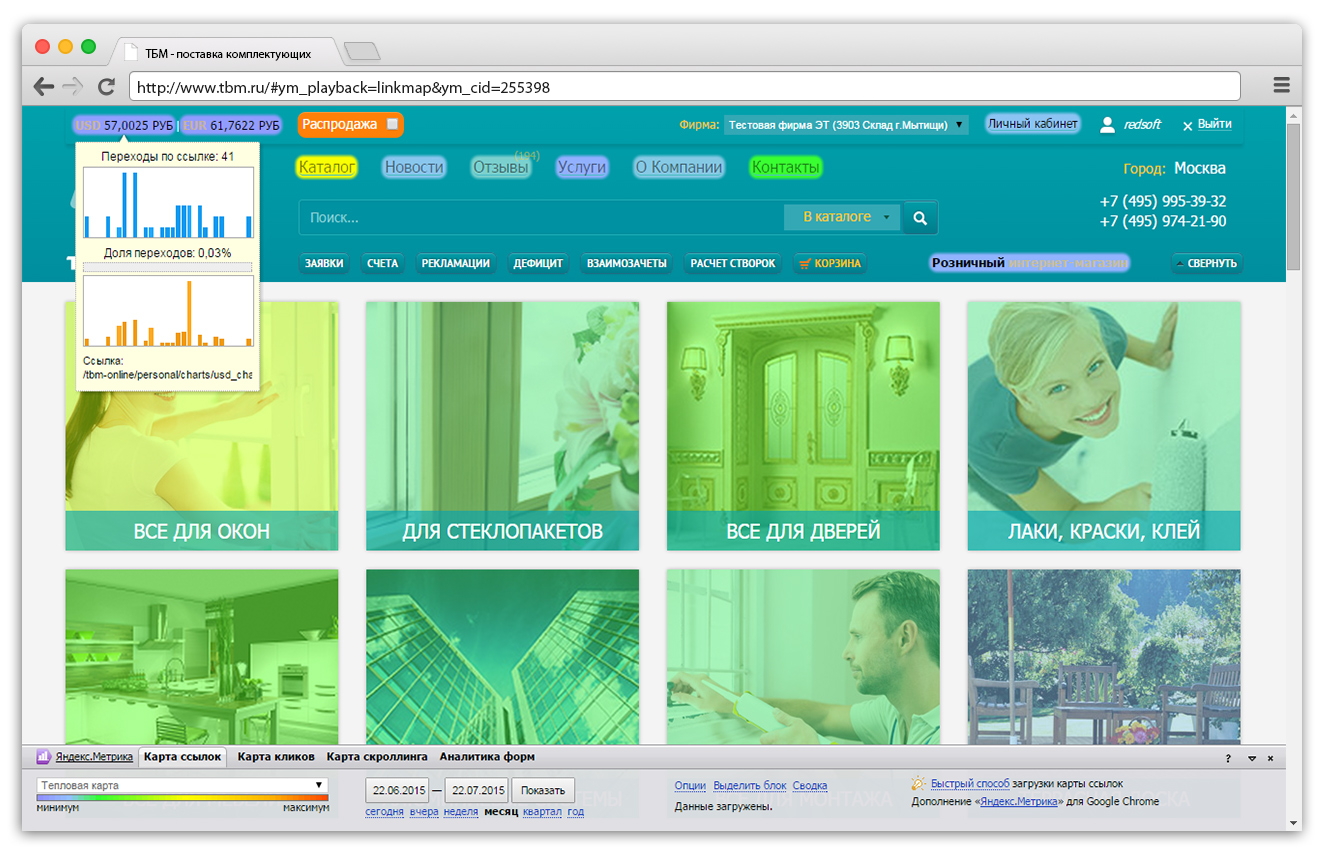
3. Traffic analysis and click tracking
Web analytics data helped me to get more information about the usage of functions and pages, and track user paths throughout the application. The data I used included page views, click paths, click maps, and link maps. It showed that a lot of features, controls, and sections were not being used and only cluttered the interface.
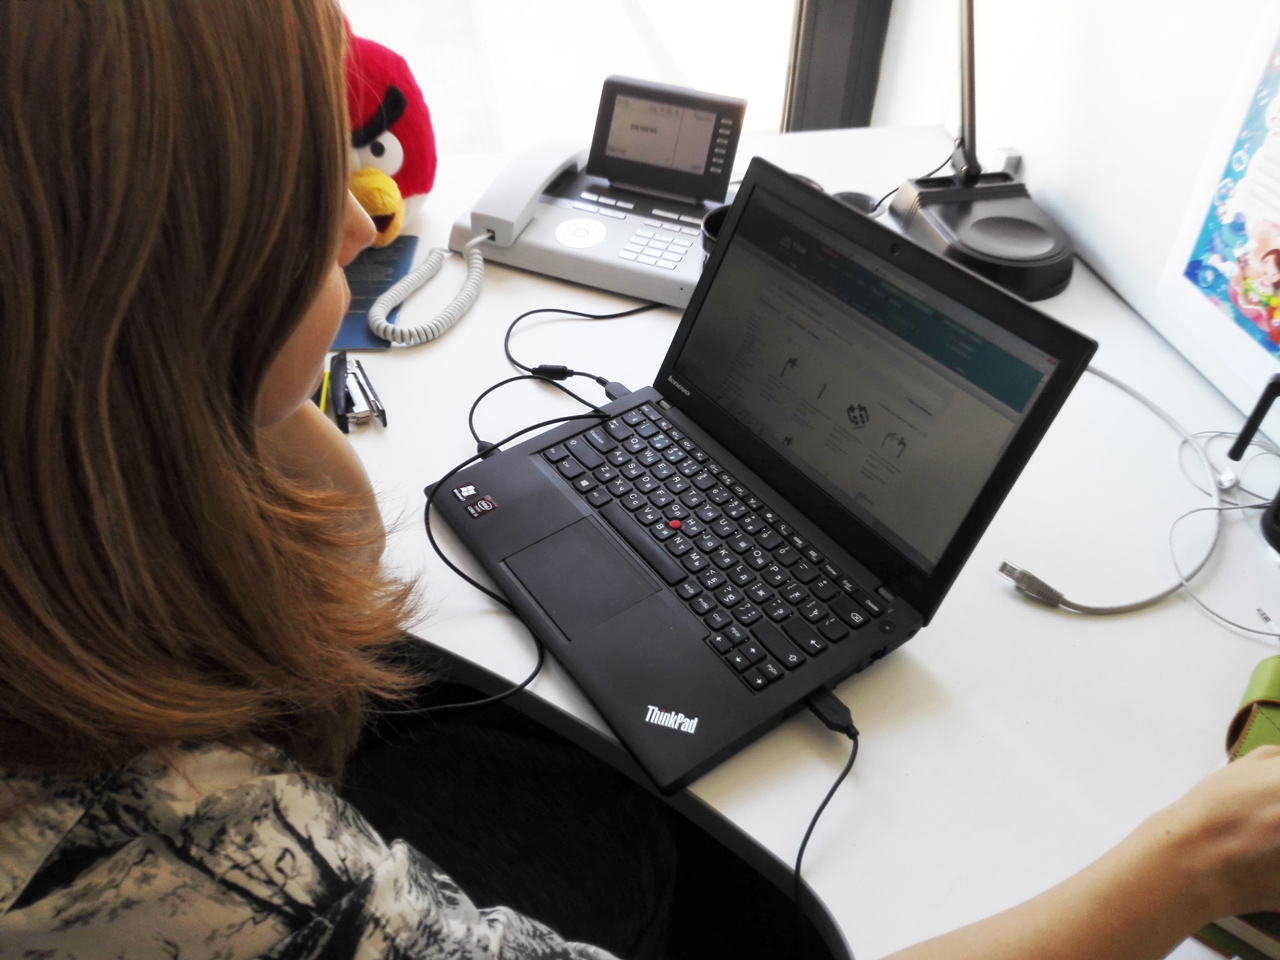
4. Contextual user interviews
The most important part of the project was to conduct interviews with real users and to discover their problems. The data from the previous steps helped me to create a questionnaire. Fifteen in-depth interviews were conducted: five in person and ten via phone. My goal was to reveal users’ pain points, even if they had already become standard procedure and were not considered as problems. As a result, I had a full picture how the users worked in the application: what features they used, how, and why they did not use some of them.

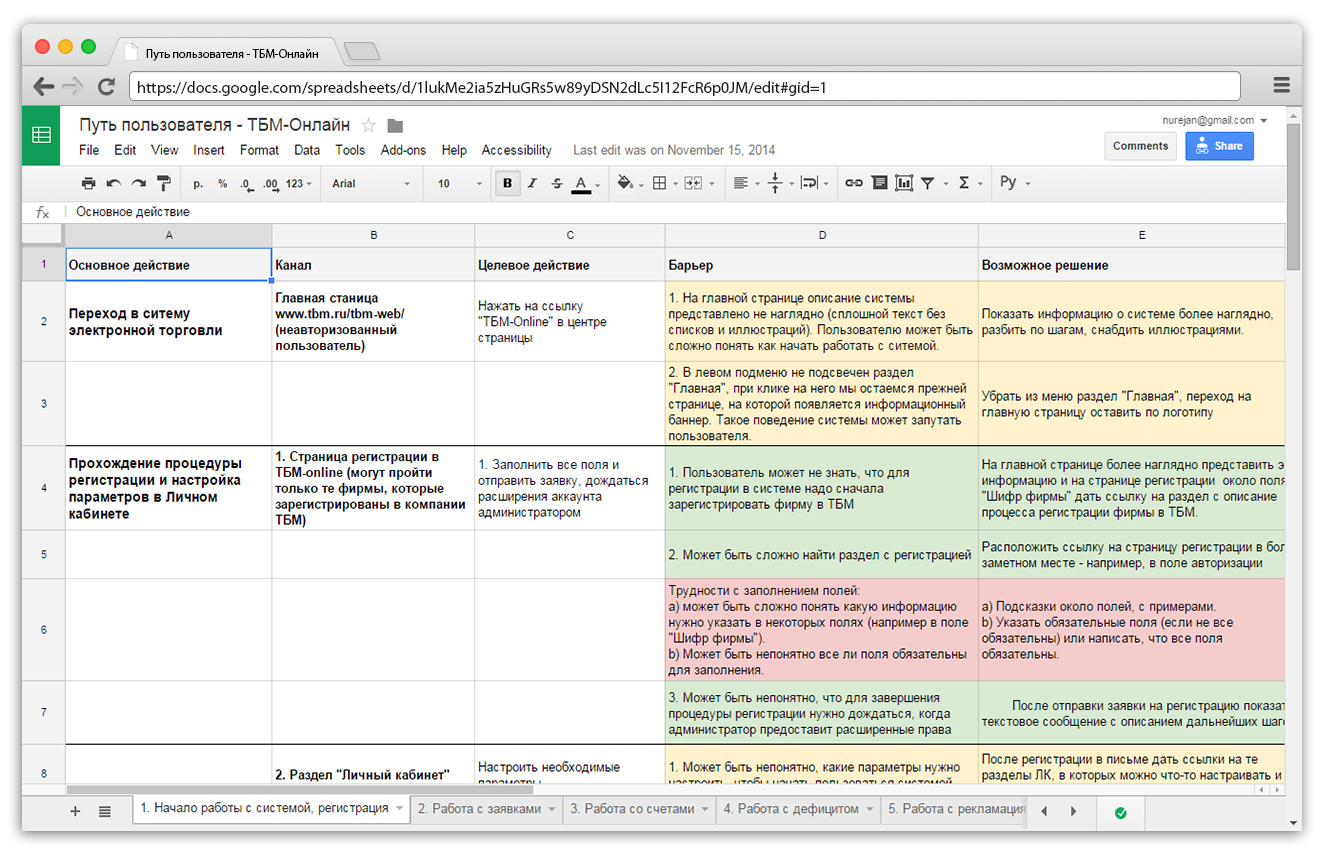
5. User journey
To create a user journey document I combined all the data from the interviews with users and customer support managers, with data analysis. The document included a description of the steps which users took to complete specific tasks, and the problems that could occur on each step. For each problem, I proposed possible solutions for the future website redesign. Severity of the problems was estimated according to their frequency, impact, and persistence, and highlighted with different colors.
6. Writing a report
Finally, I created a report with a detailed description of all interface and structural problems. It was illustrated with screenshots and included descriptions of possible solutions.